Turn numbers into people and otherwise reframe the data
Which is more dangerous? A disease that kills 1,286 out of every 10,000 people it strikes? Or one that kills 12.86% of its victims?

The former is about 20% more dangerous, said a group of college students, according to an article in Money magazine. In fact, 1,286 out of 10,000 is just a different expression of 12.86%.
“If you tell someone that something will happen to one out of 10 people,” Paul Slivic, University of Oregon psychologist, told Money, “they think, ‘Well, who’s the one?’”
To make statistics more compelling, make them more emotional.
Here are three more things to consider when choosing a frame for your data:
1. Choose a positive frame.
Which steak tastes better? A steak that’s 25% fat? Or one that’s 75% lean?

People in one study said they were more likely to buy the 75% lean steak rather than the 25% fat steak, even though they are the exact same steak (Johnson and Levin, 1985; Levin et al., 1985).
Call it the framing effect bias: People react differently to an option or idea based on how it is presented. So frame your products and positively instead of negatively.
When I wrote a charitable giving annual report, my clients were devastated to learn that 25% of Kansas City households and 21% of local businesses contributed nothing to charity. I wrote:
Today, 75% of Kansas City households and 79% of Kansas City businesses contribute to not-for-profit organizations.
Because it’s true. And it’s a better frame.
2. Tap the power of percentages.
How long would you be willing to walk to avoid a 25% Lyft or Uber fare increase? What about a 1.25x increase?
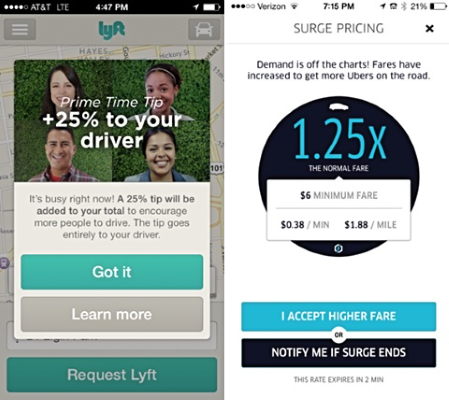
- Some 38% of people were willing to walk to avoid the 1.25x fare, according to a survey by Irrational Labs and Common Cents Lab.
- But 44% were willing to walk to avoid the 25% increase — even though 25% is the same amount as 1.25x.
- But wait! There’s more! People were more willing to walk 5 minutes to avoid a 25% increase vs. a 1.75x fare — even though 1.75 is 50 percentage points more than 25%.
Takeaway: Use absolute numbers for increases. But when offering discounts, stick with percentages.
3. Use like forms.
Which is bigger: three-quarters, 80% or seven out of 10? How much bigger?
Don’t make readers perform mathematical backflips to follow the numbers in your copy. Don’t compare apples to watermelons.
When you compare numbers, put them all in the same form. In this case: 75%, 80% and 70%.
___
Sources: I.P. Levin and G.J. Gaeth, “How consumers are affected by the framing of attribute information before and after consuming the product,” Journal of Consumer Research, No. 15, 1988, pp. 374-378
Gerd Gigerenzer and Adrian Edwards, “Simple Tools for Understanding Risks: From Innumeracy to Insight,” British Medical Journal, vol. 327, no. 7417, Sept. 27, 2003, pp. 741-744
TJ Larkin & Sandar Larkin, “Communicating Risk in Health Care,” Larkin Page, #27, February 2006
Amos Tversky and Daniel Kahneman, “The Framing of Decisions and the Psychology of Choice,” Science, Vol. 211, 30, January 1981

Reach more readers with tight writing
Would your piece be twice as good if it were half as long? Yes, say readability experts.
So how long should your message be? Your paragraphs? Your sentences? Your words? What reading ease level should you hit?
Learn how to write clearer, more concise messages at our clear-writing course.

Leave a Reply